
The most important keyword is U.S. debt burden because it captures both the scale of the problem and the report’s main finding: Americans are carrying more debt than their incomes can comfortably support. ConsumerAffairs’ latest state-by-state study shows that the average individual debt burden in the U.S. reached $63,200 in 2026, while average individual income was $45,256.
What ConsumerAffairs Is
ConsumerAffairs is a U.S.-based consumer review and research platform founded in 1998, best known for publishing large-scale consumer reports and helping people compare financial, home, and service products. The company also publishes original research using public data, and it says it primarily relies on government data, industry experts, and original research from reputable publications.
For this report, ConsumerAffairs’ Research Team combined federal debt data with Census income data to measure where Americans are most burdened by debt. That makes this study more than a news article; it is a structured data analysis of the U.S. debt burden across all 50 states and Washington, D.C.
How the Study Was Done
ConsumerAffairs analyzed debt balances and serious delinquency rates using the Federal Reserve Bank of New York’s Household Debt and Credit data for Q4 2025, then paired that with U.S. Census Bureau per-capita income data from 2024. The study ranked all states and Washington, D.C. across two equally weighted categories, with a possible total score of 100 points.
The two categories were:
- Debt-to-income ratio, worth 50 points, based on total debt per capita relative to per-capita income.
- Serious delinquency rates, worth 50 points, based on the share of debt that is 90 or more days past due.
For delinquency, ConsumerAffairs examined mortgages, auto loans, credit cards, and student loans, then weighted them within the score. Historical debt figures were adjusted for inflation to November 2025 dollars, which is important because it lets the report track the U.S. debt burden in real terms rather than misleading nominal terms.
Main Findings
The report’s biggest headline is that Utah ranks as the most debt-burdened state, with a debt-to-income ratio of 199.4%, meaning the average resident carries nearly twice as much debt as annual income. Louisiana ranks second overall, driven by the nation’s highest mortgage delinquency rate at 1.83% of balances 90 days past due.
Nevada stands out for credit card stress, with 16.3% of credit card balances in serious delinquency, which is about four points above the national average. Mississippi has the highest student loan delinquency rate at 13.4% of balances 90 days past due. Wisconsin ranks as the least debt-burdened state because it has the lowest delinquency levels for mortgages, credit cards, and student loans.
The report also shows that since 2003, total debt per capita has climbed from $32,840 to $63,200, which is about a 10% increase after inflation adjustment. Over the same period, auto loan debt rose 9% in real terms, mortgage debt rose 6%, and credit card debt fell 16% in inflation-adjusted terms. The fastest-growing category is student loan debt, which has nearly tripled since 2003 after inflation adjustm
The most important keyword is U.S. debt burden because it captures both the scale of the problem and the report’s main finding: Americans are carrying more debt than their incomes can comfortably support. ConsumerAffairs’ latest state-by-state study shows that the average individual debt burden in the U.S. reached $63,200 in 2026, while average individual income was $45,256.
What ConsumerAffairs Is
ConsumerAffairs is a U.S.-based consumer review and research platform founded in 1998, best known for publishing large-scale consumer reports and helping people compare financial, home, and service products. The company also publishes original research using public data, and it says it primarily relies on government data, industry experts, and original research from reputable publications.
For this report, ConsumerAffairs’ Research Team combined federal debt data with Census income data to measure where Americans are most burdened by debt. That makes this study more than a news article; it is a structured data analysis of the U.S. debt burden across all 50 states and Washington, D.C.
How the Study Was Done
ConsumerAffairs analyzed debt balances and serious delinquency rates using the Federal Reserve Bank of New York’s Household Debt and Credit data for Q4 2025, then paired that with U.S. Census Bureau per-capita income data from 2024. The study ranked all states and Washington, D.C. across two equally weighted categories, with a possible total score of 100 points.
The two categories were:
- Debt-to-income ratio, worth 50 points, based on total debt per capita relative to per-capita income.
- Serious delinquency rates, worth 50 points, based on the share of debt that is 90 or more days past due.
For delinquency, ConsumerAffairs examined mortgages, auto loans, credit cards, and student loans, then weighted them within the score. Historical debt figures were adjusted for inflation to November 2025 dollars, which is important because it lets the report track the U.S. debt burden in real terms rather than misleading nominal terms.
Main Findings
The report’s biggest headline is that Utah ranks as the most debt-burdened state, with a debt-to-income ratio of 199.4%, meaning the average resident carries nearly twice as much debt as annual income. Louisiana ranks second overall, driven by the nation’s highest mortgage delinquency rate at 1.83% of balances 90 days past due.
Nevada stands out for credit card stress, with 16.3% of credit card balances in serious delinquency, which is about four points above the national average. Mississippi has the highest student loan delinquency rate at 13.4% of balances 90 days past due. Wisconsin ranks as the least debt-burdened state because it has the lowest delinquency levels for mortgages, credit cards, and student loans.
The report also shows that since 2003, total debt per capita has climbed from $32,840 to $63,200, which is about a 10% increase after inflation adjustment. Over the same period, auto loan debt rose 9% in real terms, mortgage debt rose 6%, and credit card debt fell 16% in inflation-adjusted terms. The fastest-growing category is student loan debt, which has nearly tripled since 2003 after inflation adjustment.
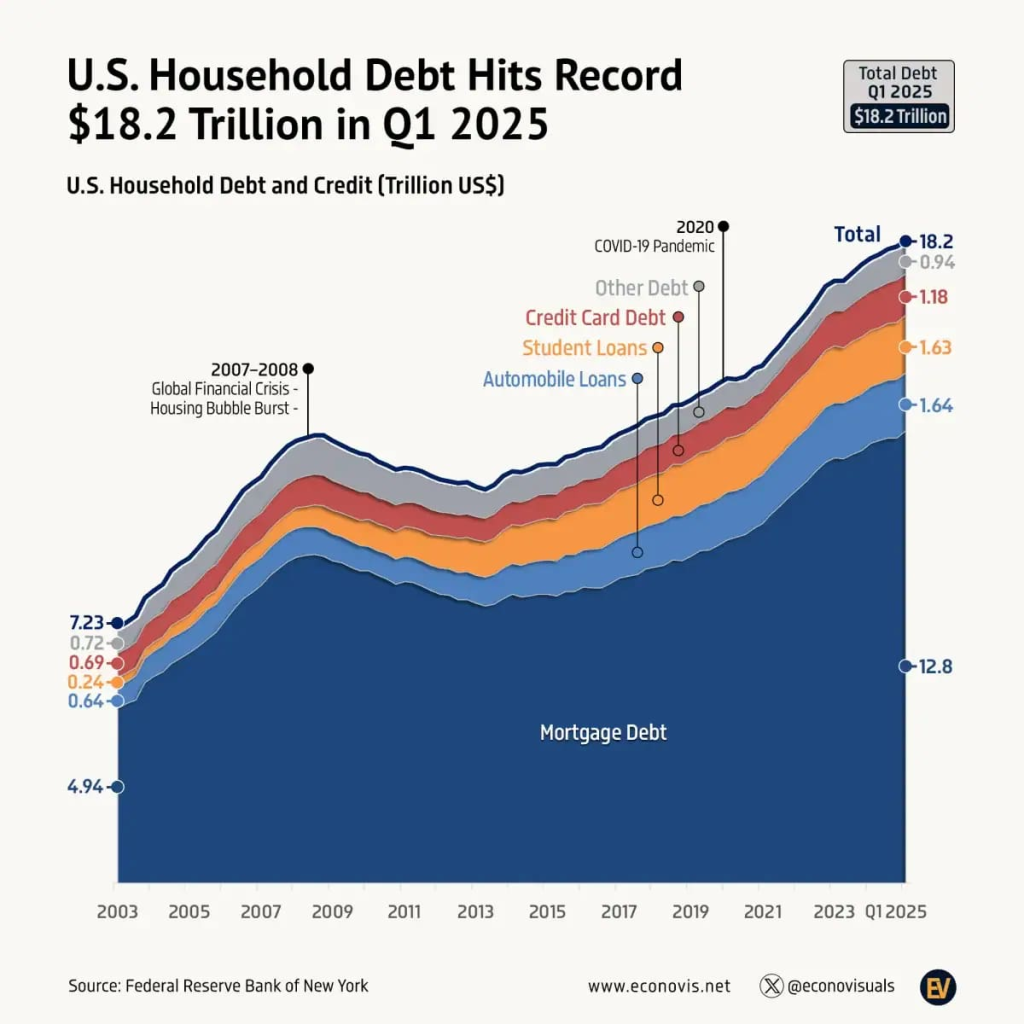
This chart-style image shows the long-term rise in U.S. household debt and how the balance of debt categories has shifted over time. (Image source: Federal Reserve Bank of New York visualized in a ConsumerAffairs-related infographic, original image link: here)
Why the Burden Is Rising
ConsumerAffairs highlights a broader pattern: debt is not only large, but harder to manage because incomes have not kept up evenly across the country. The report notes that the worst-ranked states all have below-average incomes, which makes it easier for debt to outrun earnings.
Another major issue is delinquency. ConsumerAffairs cites Achieve survey results showing that 51% of consumers took risky financial actions after falling short on debt, including using emergency savings, missing payments, or skipping medical treatment. That is a sign that the U.S. debt burden is starting to affect daily life, not just balance sheets.
Separate market data points in the same direction. The New York Fed reported that total household debt reached $18.8 trillion in Q4 2025, while Equifax reported total consumer debt of $18.21 trillion in January 2026. LendingTree also reported that credit card balances hit roughly $1.277 trillion and average card APRs were about 21.52% in early 2026.
Stories Behind the Numbers
Stressed couple managing budget
One useful way to understand the U.S. debt burden is to think about what the report means in real life. In Utah, a young homeowner may look financially secure from the outside, but the report suggests that the average resident is carrying debt equal to almost two years of income. That can happen when mortgage debt, auto loans, and student loans all stack up at once.

This image reflects the everyday pressure that household bills and debt can create at the kitchen table. (Image source: stock photo, original image link: here)
In Nevada, the problem is different but just as serious: high credit card delinquency suggests that many households are not just borrowing, but struggling to keep up with payments. That is the moment when debt stops being a tool and becomes a trap.
In Mississippi, student loan delinquency is especially high, which hints at a painful mismatch between educational borrowing and local earning power. The report’s real value is that it shows how the U.S. debt burden is not one single national story, but many different state-level stories.
Practical Ways to Reduce Debt
The report’s advice is practical and worth repeating because the best response to rising debt is a clear plan. The first step is to know exactly what you owe, because you cannot reduce debt you have not mapped.
A simple framework is to calculate your debt-to-income ratio and then decide which debts deserve priority. ConsumerAffairs notes that a DTI of 36% or lower is generally manageable, while 43% or higher is a warning sign for many borrowers.
The two classic repayment methods are:
- Debt avalanche: pay the highest-interest debt first to minimize total interest.
- Debt snowball: pay the smallest balance first to build momentum.
For most households facing a high U.S. debt burden, the avalanche method is mathematically cheaper, especially when credit card APRs are above 20%. But the snowball method can be more motivating if you need quick wins to stay disciplined.
Refinancing or consolidating debt may also help, especially if your credit profile has improved since you first borrowed. Even a 1% to 2% rate reduction can save hundreds of dollars a year on some loans.
Smart Habits That Actually Work
Reducing debt is not only about making bigger payments. It is also about changing the system around your spending so the U.S. debt burden stops growing in the first place.
Helpful habits include:
- Freeze or limit high-interest revolving credit use.
- Redirect any savings from cutting subscriptions or dining out into debt payments.
- Build a small emergency fund so unexpected expenses do not go back on a credit card.
- Keep due dates organized so late fees and penalty APRs do not add fuel to the problem.
SSRS found that many Americans are already responding to financial pressure by cutting nonessential spending and prioritizing debt repayment. That means debt reduction is often less about perfect behavior and more about consistent, automated behavior.
Sources and Links
- ConsumerAffairs report: Where Americans Are Drowning in Debt — and Falling Behind
- ConsumerAffairs debt overview: Average American debt statistics 2024
- New York Fed Household Debt and Credit: Q4 2025 report
- New York Fed data hub: Household Debt and Credit Report
- Equifax report: January 2026 U.S. National Consumer Credit Trends Report
- LendingTree credit card debt stats: 2026 Credit Card Debt Statistics
- SSRS financial burden study: Understanding Americans’ Finances
- CFPB complaint and debt help page: Submit a complaint